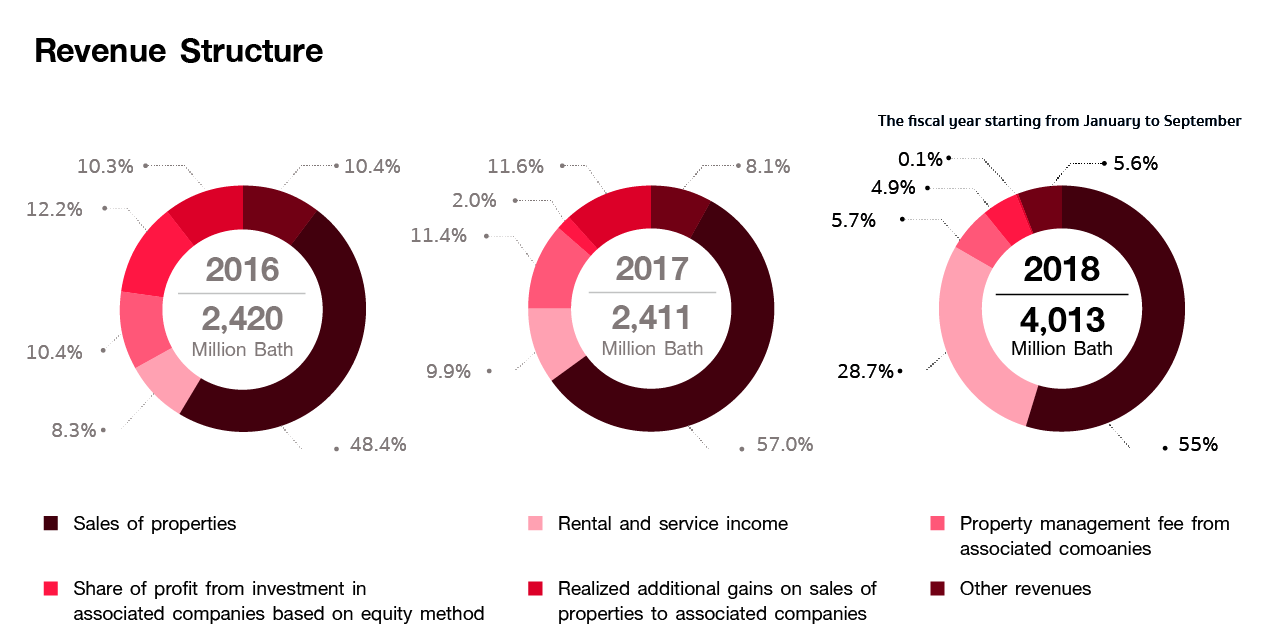
| Unit : Million Baht | |||
| 2016 | 2017 | Jan-Sep 2018 |
|
|---|---|---|---|
| Sales of properties | 250.68 | 194.36 | 2,209.57 |
| Rental and service income | 1,172.12 | 1,372.60 | 1,150.86 |
| Property management fee from property funds | 201.12 | 239.15 | 226.90 |
| Share of profit from investments in property funds/reit | 252.22 | 275.42 | 195.56 |
| Realized additional gain on sales of properties to property funds/reit | 294.95 | 48.30 | 2.69 |
| Cost of sales of properties | 160.16 | 77.27 | 1,593.53 |
| Cost of rental and service | 332.56 | 409.83 | 343.53 |
| Selling and administrative expenses | 704.04 | 786.61 | 795.44 |
| Net profit | 278.10 | 482.40 | 667.66 |
| Assets | 36,092.73 | 40,982.31 | 42,999.07 |
| Liabilities | 24,675.06 | 16,048.07 | 17,618.79 |
| Shareholders' equity | 11,417.67 | 24,934.24 | 25,380.28 |
| Return on equity (%) | 2.38 | 2.64 | 3.49 |
| Return on fixed assets (%) | 2.31 | 3.20 | 3.57 |
| Dividend pay-out (%) | 53.35 | 38.21 | 74.17 |
